Fluent Bit use case
Portfolio
System overview
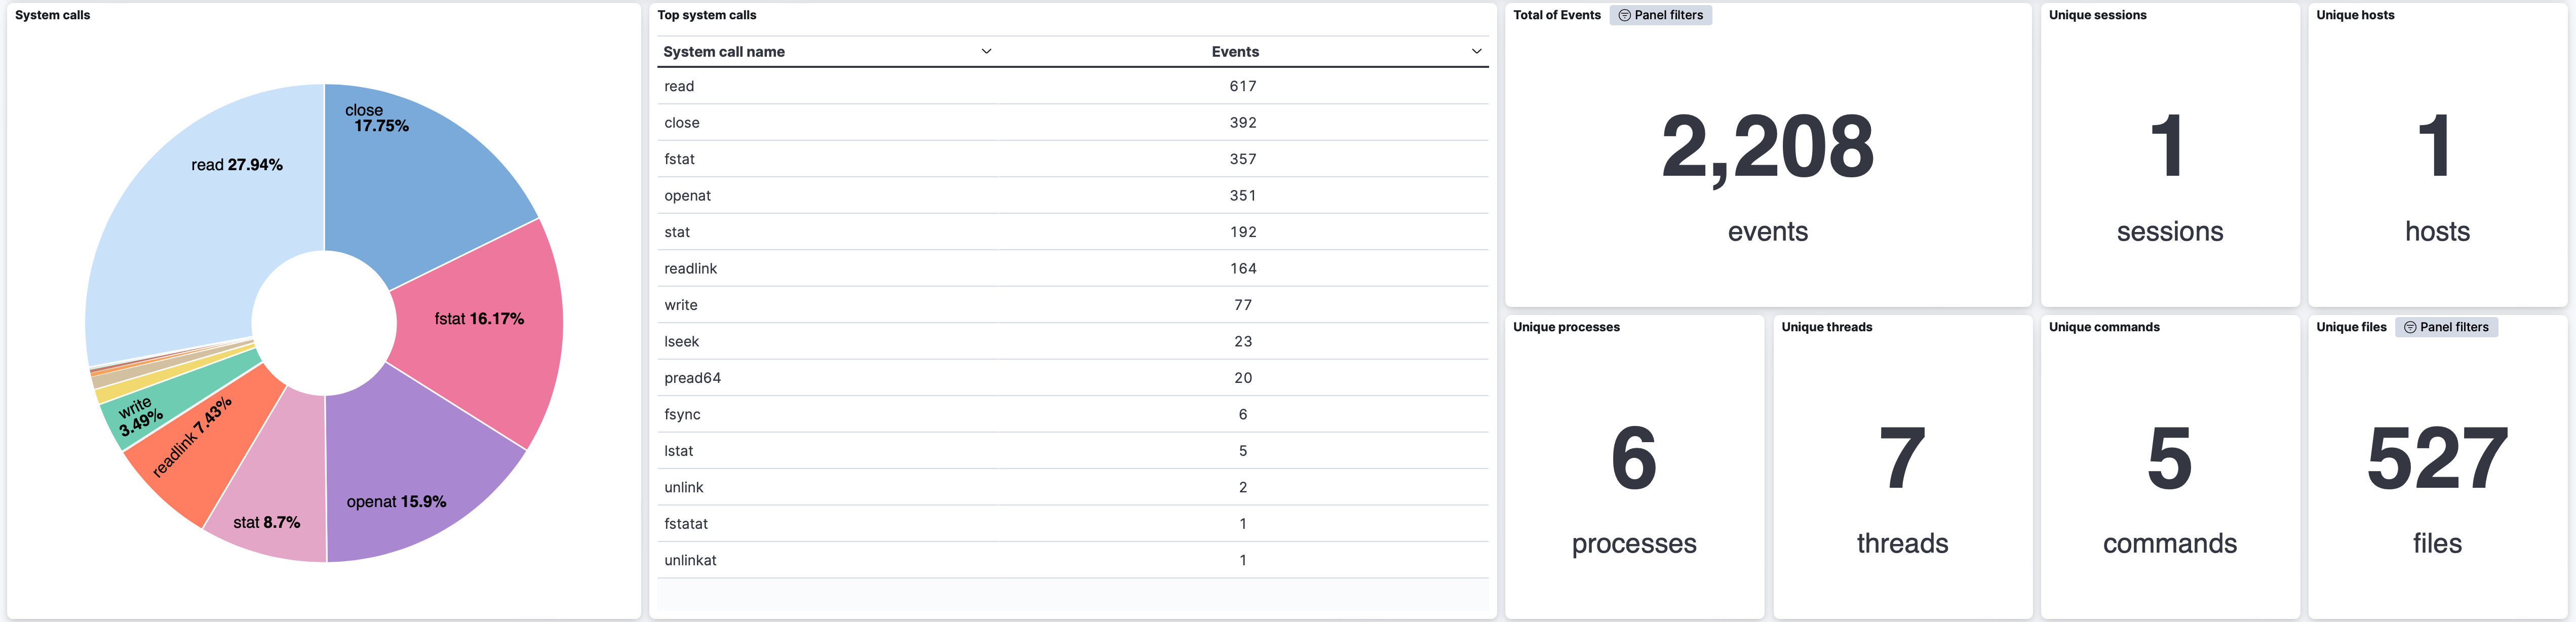
Generic statistics about the application execution
fluent-bit and app together issued about 2,000 storage system calls, most of which were read system calls.
In total, 6 processes and 7 threads were spawned, and more than 500 files were accessed.
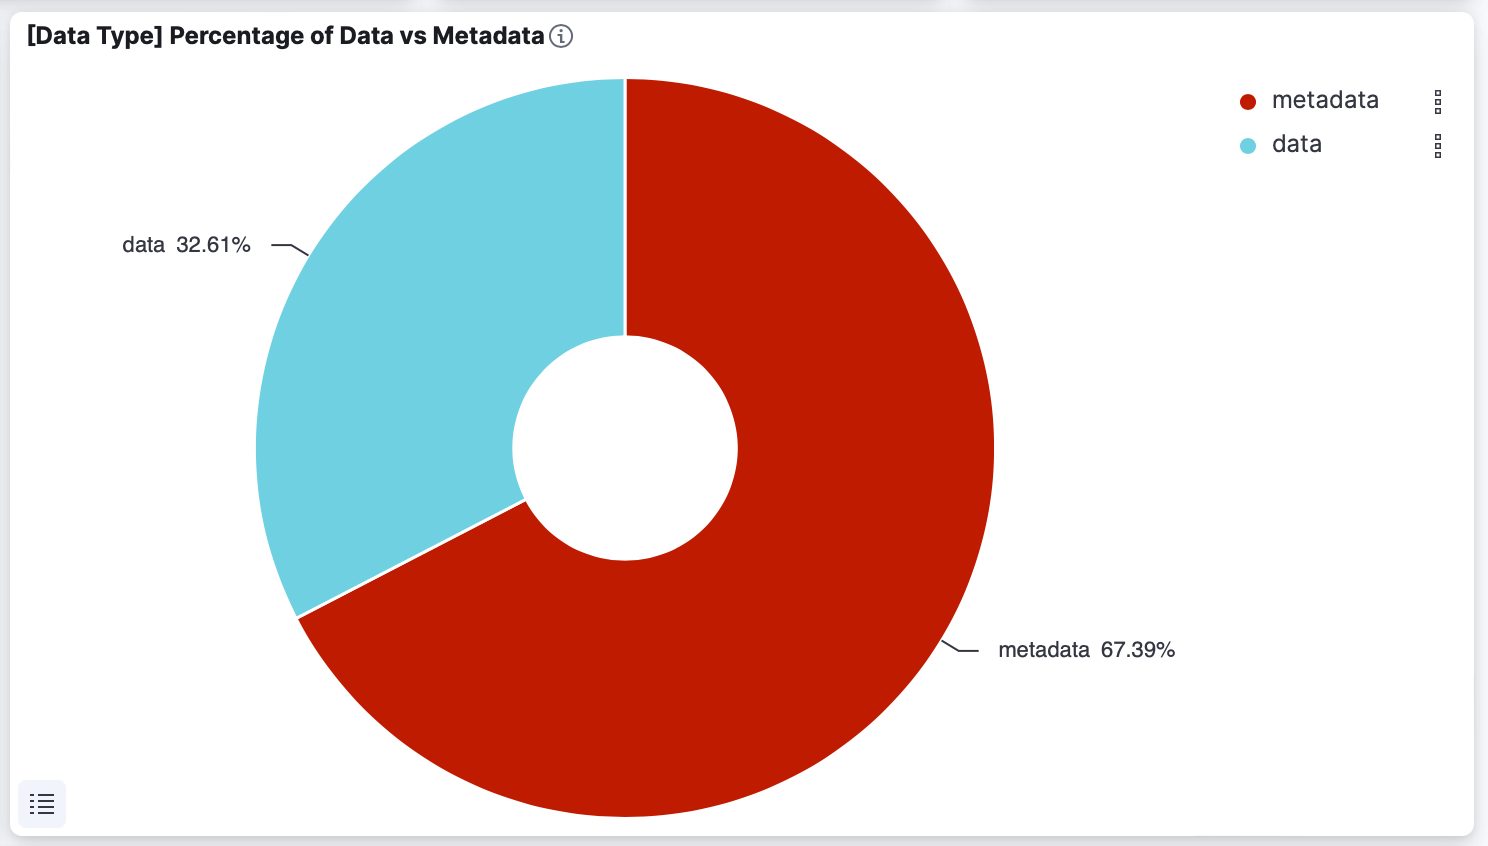
Percentage of data vs metadata
Shows the percentage of data and metadata-related system calls
67% of the system calls were metadata-related, while 33% were data-related.
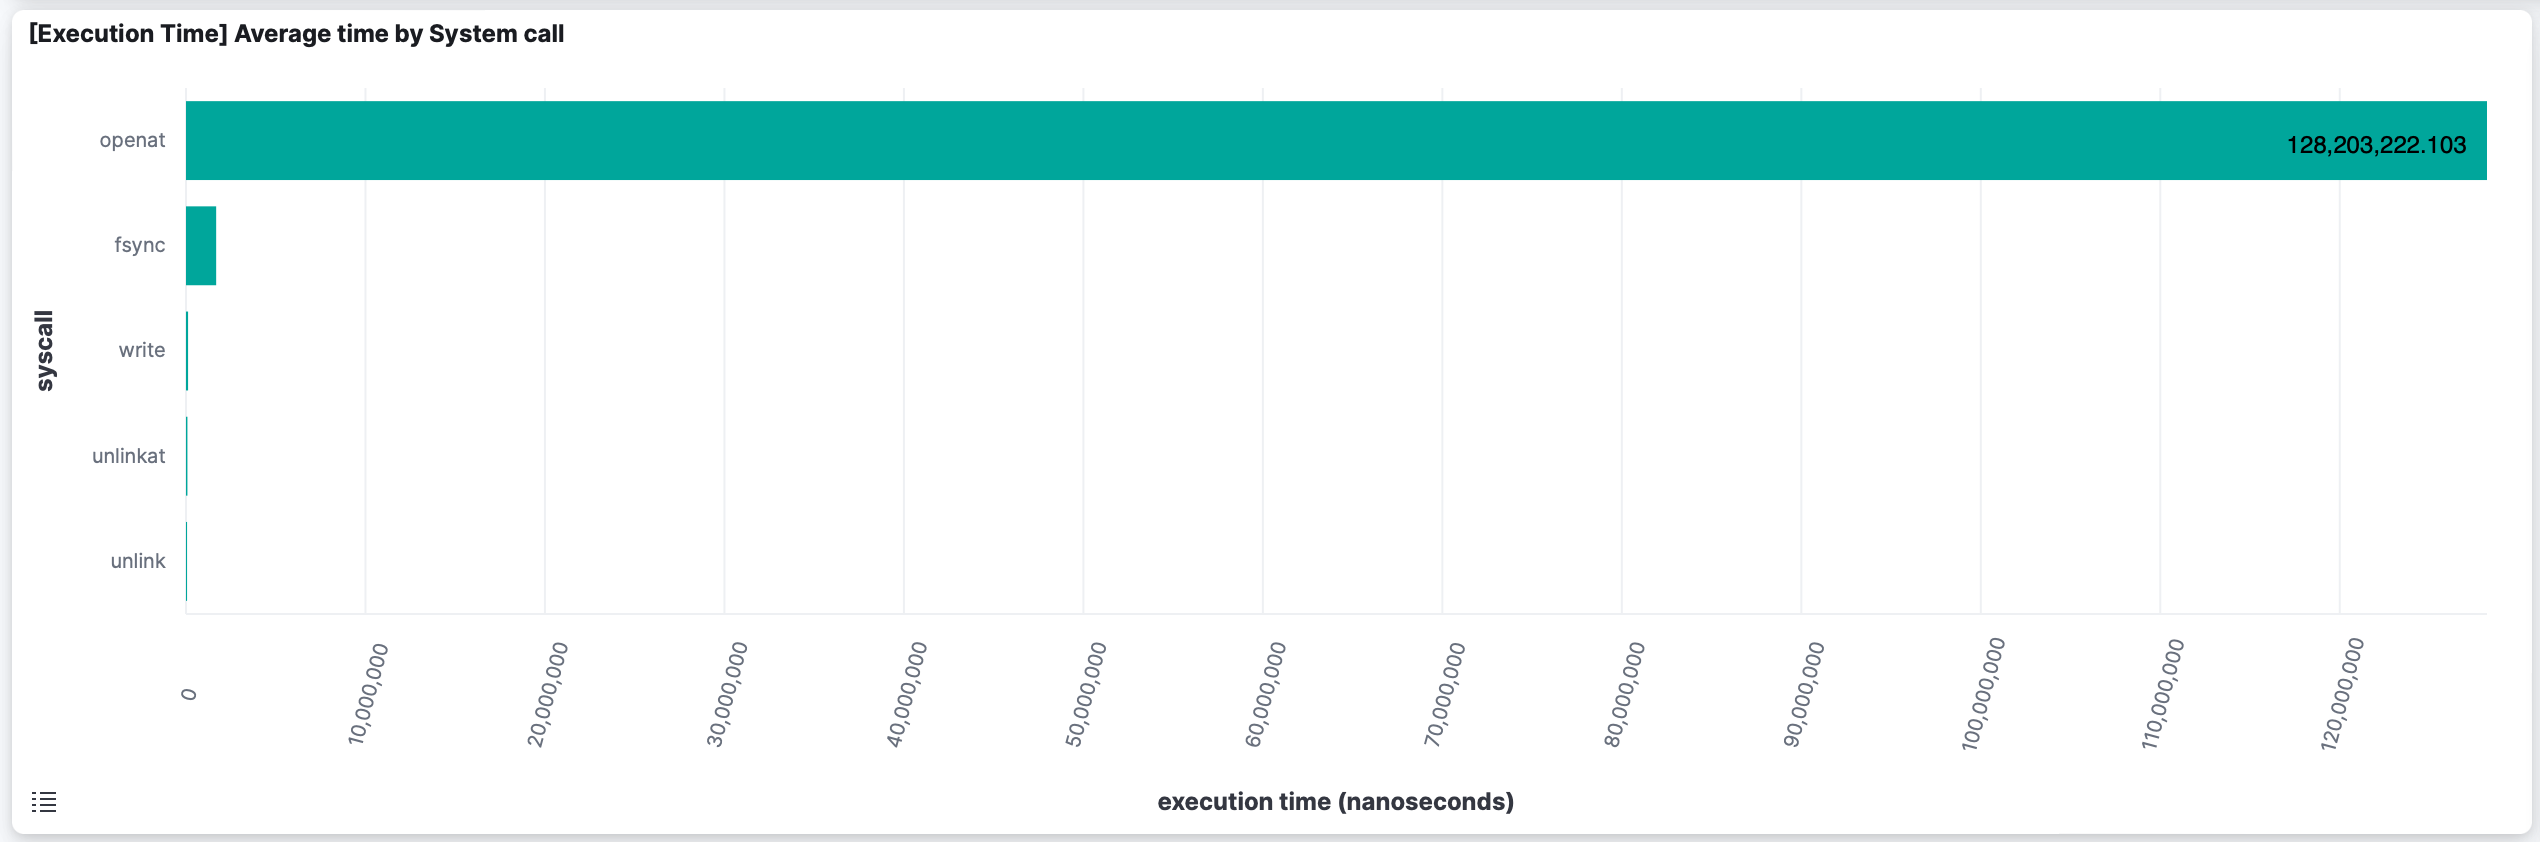
Execution time per system call
Shows the average execution time for the top 5 system calls
The system call with the highest average execution time was openat, which took 128 milliseconds on average.
The fsync system call was the second most expensive system call, with an average execution time of 1,68 milliseconds.
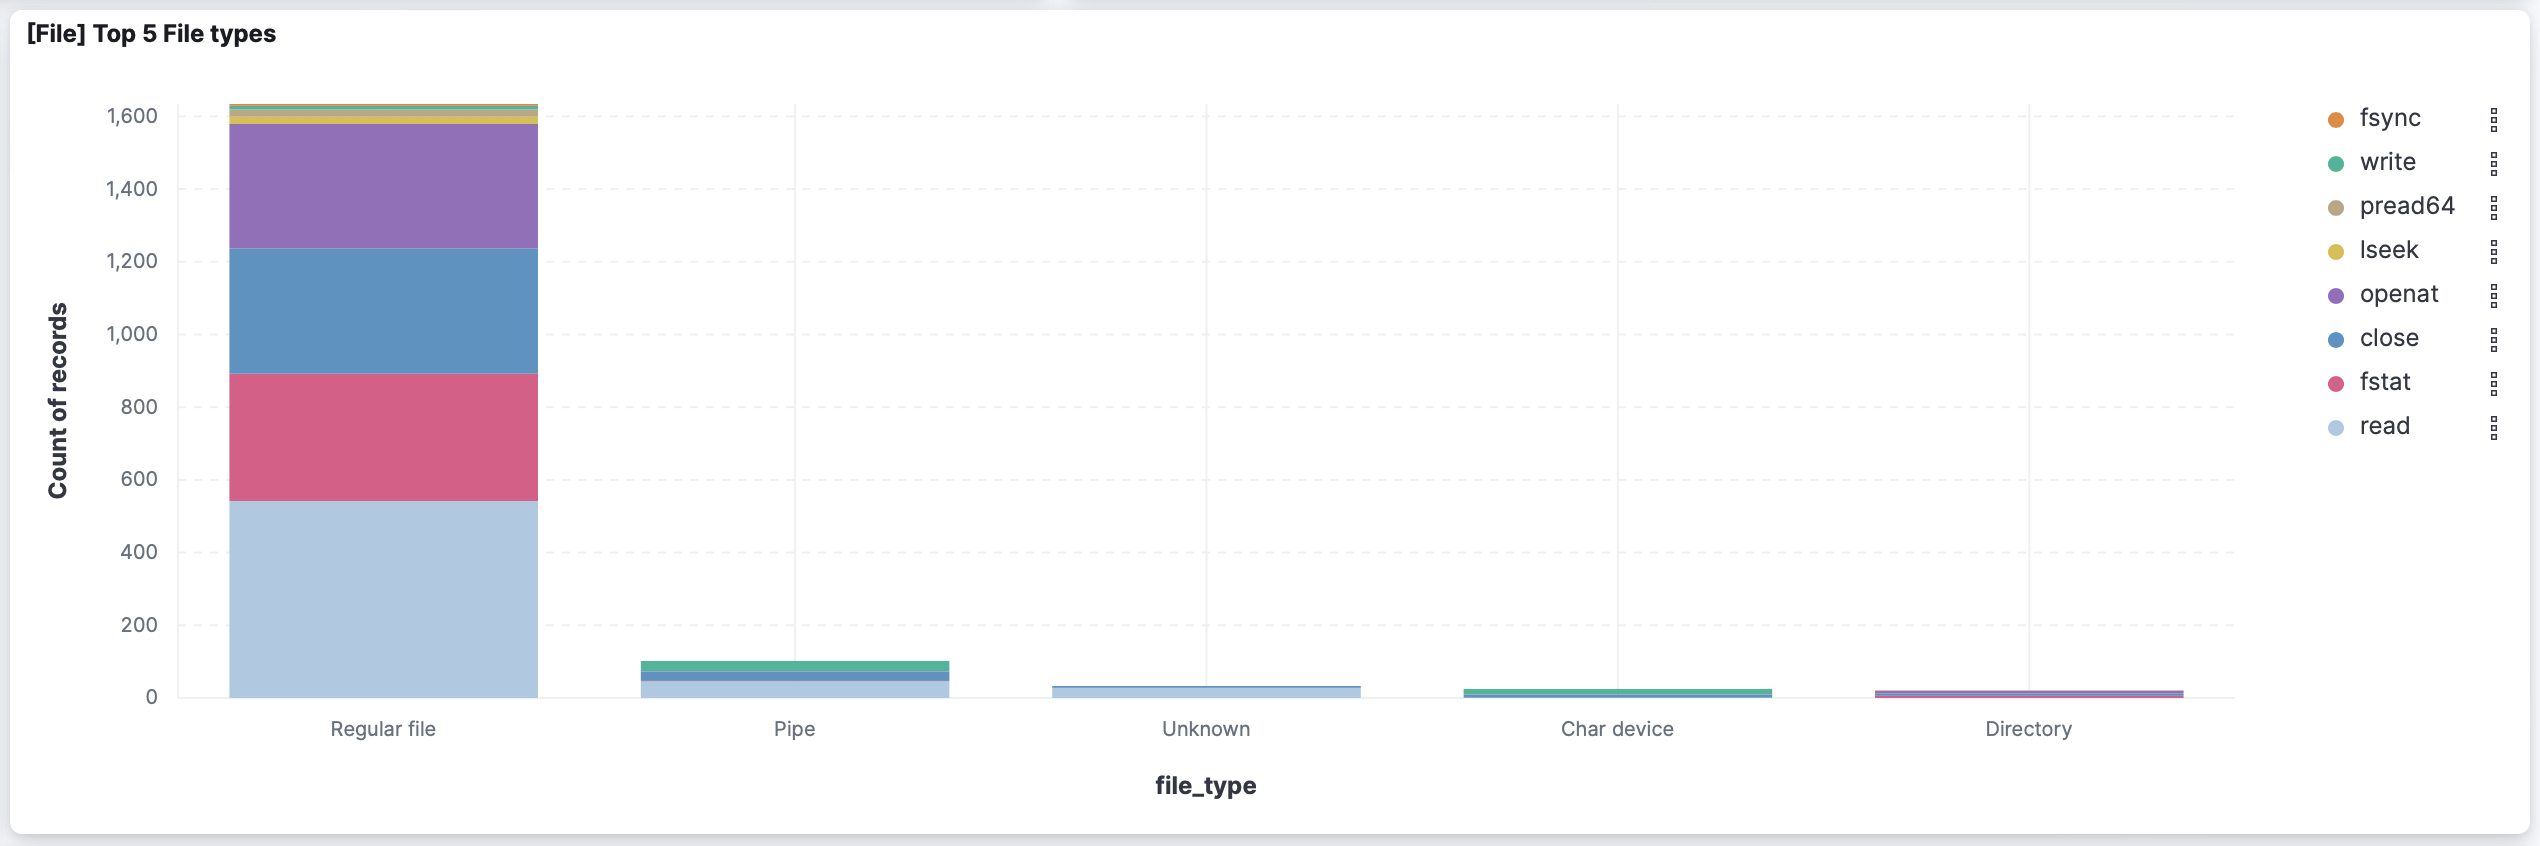
Top file types
Shows the type of files accessed by the application and the number of system calls issued for each file type
The top file types accessed during the app execution were: 1600 system calls for Regular files, ~100 system calls for Pipes, and less than 50 system calls for Char devices, Directories and Unknown type.
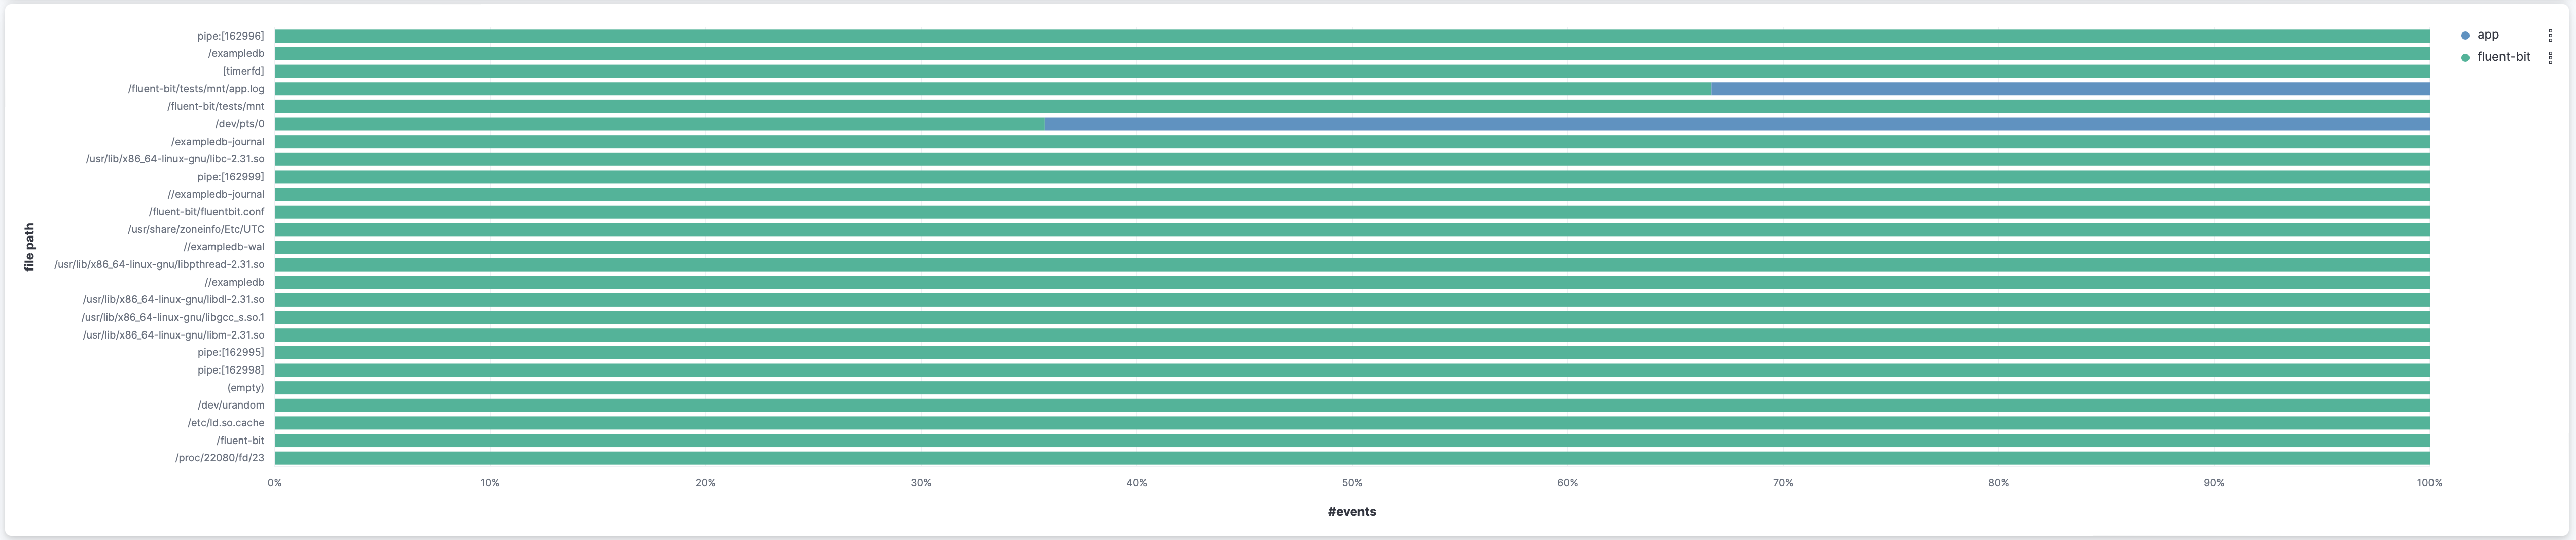
File accesses per command
Shows the total number of system calls issued to files by each command
Two files were accessed both by Fluent Bit and the client application: app.log and /dev/pts/0.
66% of the system calls were issued to the app.log were made by by Fluent Bit.
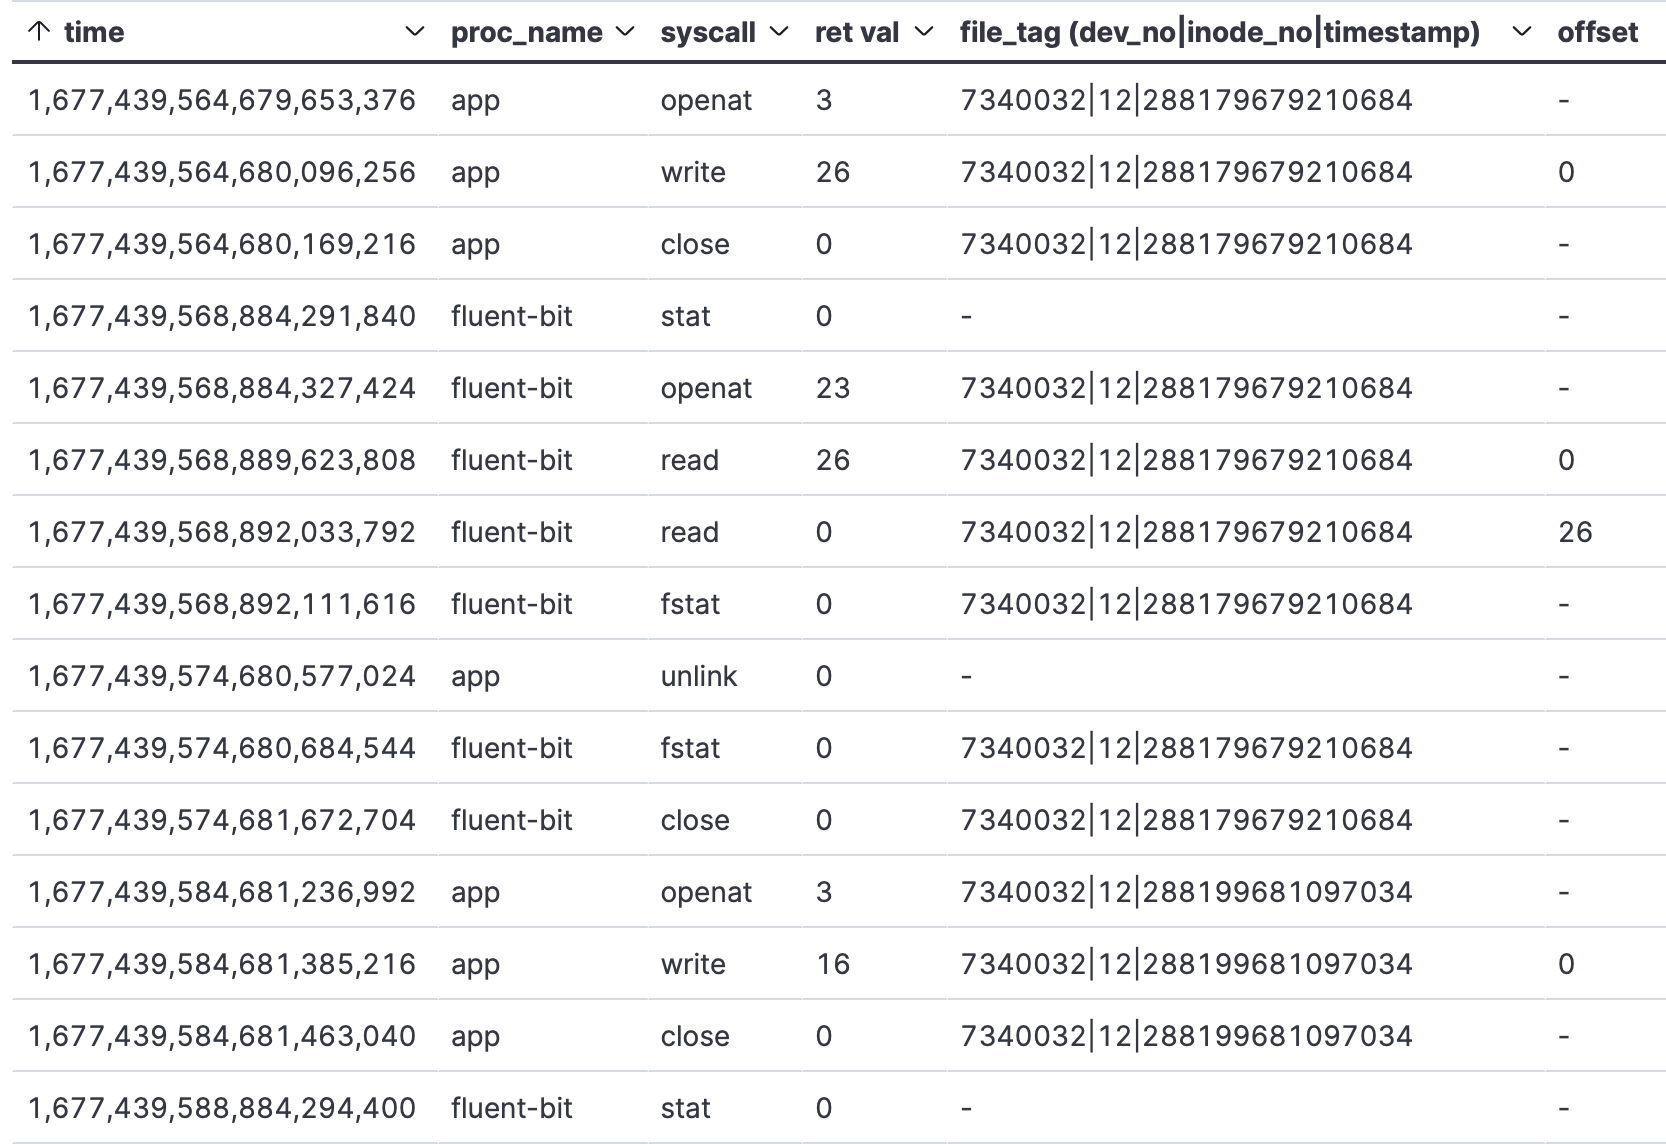
File access pattern for app.log file
Shows the access pattern for the app.log file performed both by Fluent Bit and the client application
The app command creates the app.log file, writes 26 bytes to offset 0 and closes it.
Fluent Bit opens the app.log file and reads the 26 bytes from offset 0.
app then removes the file and creates a new one with the same name, to which it writes 16 bytes at offset 0.
Fluent Bit opens the new app.log file and attempts to read from offset 26, which returns 0.